Into the darkness

2015-02-13 17.35.07

#LCY #FRA #BA #E190SR

Posted in Uncategorized | Tagged , , , | Comments closed

Wet City

2015-02-13 17.04.43

2015-02-13 17.05.00

2015-02-13 17.06.30

#LCY #LondonCityAirport

Posted in Uncategorized | Tagged , | Comments closed

Afterglow

2015-02-10 07.37.17

#FRA #LCY #BA #E190SR

Posted in Uncategorized | Tagged , , , | Comments closed

Crossroads

2015-02-07 13.53.15

Posted in Uncategorized | Comments closed

Lowering all the MTTs…

Adam Jacob (@adamhjk) the CTO of Opscode Chef recently gave a talk at Velocity Santa Clara 2014 titled “How to be great at operations”. You should go read the slides. Go now, I’ll wait. Just a hint though, use your space bar to move through the non-linear navigation, you’ll thank me later.

You’re back? Good.

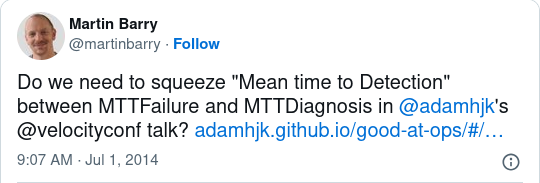
This was my initial reaction:


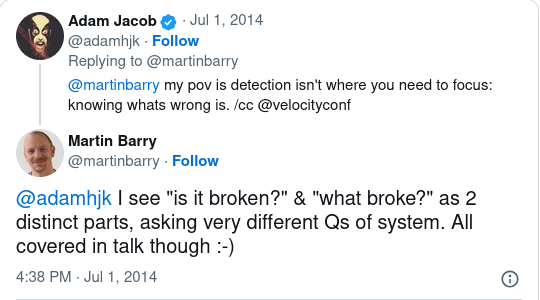
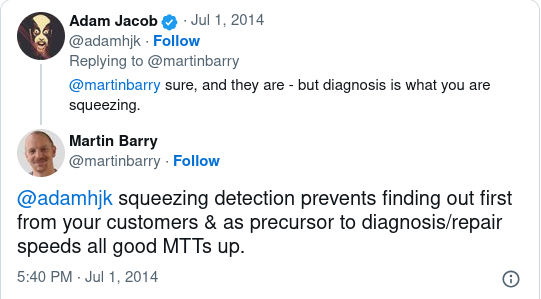
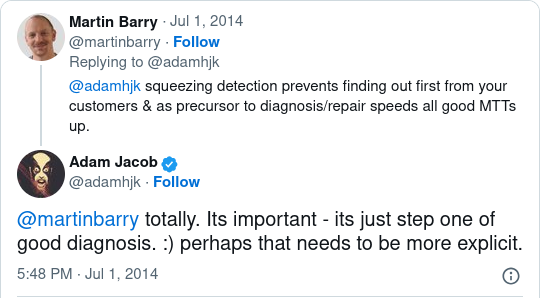
…which triggered a discussion with Adam that suffered from the “140 characters just aren’t enough” problem:


Basically I was trying to assert that detection of problems is such an important step in the life-cycle Adam outlines in slide 6-3 that it should be explicitly stated rather than included in diagnosis.

I think it deserves this because often the question “is something broken?” is not considered in a broad enough context when people devise, deploy and configure monitoring systems.

There is often a focus in operations of monitoring various parameters that would help people understand the health of the system, but they tend to be skewed towards easily measurable things about hardware, operating systems and utilisation.

As a monitoring system matures it takes on more functional aspects, exercising workflows that a normal client might undertake and including metrics that more meaningful describe the “throughput” of the system.

The end result is monitoring that covers the full spectrum from what could be termed “business metrics” (sign up rate, sales conversions, sales value) to what could be termed “technical metrics” (RAM or CPU utilisation, network packet loss / jitter / latency).

In simple, naive infrastructure architectures the answer to the question “is something broken?” tends to be answered with technical metrics. As infrastructure matures, becomes more distributed, scales, the same question tends to be answered with business metrics. This is not to say that you won’t be paged in the middle of the night for disk space issues but the aim of any operations group is for these “technical issues” to not affect the externally observable functionality of “the system” and hence they become less severe, ideally handled “best effort” without waking anyone up. Therefore business metrics become a better indicator of the holistic health of the system and hence better at identifying the onset of customer affecting problems.

Improving detection of customer affecting problems is important because it prevents your customers being canaries and allows system status communication to happen sooner. It is also the precursor to any of the following steps, so lowering the MTT on it has flow on affects that will also bring down the MTTs for diagnosis and repair.

A good post-mortem of a customer affecting incident should always cover “how could we have detected this problem sooner”. What business or technical monitoring and metrics indicated abnormalities which in the future could allow us to take preventative action before it affects customers or start earlier on diagnosing an actual problem? You can’t just focus improvements on the monitoring that helps in diagnosing the underlying causes as these are often not enough on their own to indicate that customers are experiencing some kind of problem.

In summary I think slide 6-3 should look like:

  • Mean Time To Failure: The average time there is correct behavior
  • Mean Time To Detection: The average time it takes to be aware there is a problem
  • Mean Time To Diagnose: The average time it takes to diagnose the problem
  • Mean Time To Repair: The average time it takes to fix a problem
  • Mean Time Between Failures: The average time between failures
Posted in Tech, WebOps | Comments closed

Symantec, you’re doing it wrong…

At work we had an SSL certificate that is no longer required, so we want to quietly let it expire and get on with our lives. Unfortunately Symantec is doing their best to trick us into renewing it. It mentions an “order number” even though we haven’t ordered anything (perhaps their system persistently uses the original order reference instead of generating a new one for the renewal?) and that “payment has failed” even though there was no attempt to renew it. There is also no way to explicitly indicate to them that you want to let the certificate lapse and stop hassling you about it. This is the kind of scam email I would expect from dodgier companies but it seems Symantec can stoop this low too:

Sehr geehrter Kunde,

Ihr Zertifikat wurde widerrufen, weil Ihre Zahlung nicht akzeptiert wurde. Diese Benachrichtigung bezieht sich auf die folgende Bestellung:

Bestellnummer: xxxxxxxxx
Name des Zertifikats: xxxxxxxxxx

Vergessen Sie nicht, dass SSL-Lösungen von Symantecâ„¢ dazu beitragen, Vertrauen bei Kunden im Hinblick auf Interaktionsschnittstellen aufzubauen – angefangen bei der Suche, über das Browsen und bis hin zum Kauf. Wenn Sie Ihre Meinung ändern, können Sie selbstverständlich ein neues Symantecâ„¢ SSL-Zertifikat erwerben. Loggen Sie sich einfach bei Ihrem Symantecâ„¢ Trust Center-Konto ein:
https://trustcenter.websecurity.symantec.com/process/retail/trust_console_login?application_locale=VRSN_DE

Chatten Sie mit dem Kundensupport, wenn Sie Fragen haben oder Hilfe benötigen:
https://knowledge.verisign.de/support/ssl-certificates-support/index?page=chatConsole

Vielen Dank!
Abteilung Kundensupport von
https://knowledge.verisign.com/support/trust-seal-support/index.html

So what is their suggestion to stop these scammy emails? Change the associated email address to /dev/null of course!

Jackson : Good day, how may I help you today?
Martin Barry: We had an SSL certificate that is no longer required. Why do you keeping sending scam like emails “your certificate was revoked because your payment was not accepted”?
Martin Barry: It includes an “order number” like it was an invoice that was not paid correctly, seems designed to trick someone into renewing it.
Martin Barry: It’s slimey and not the kind of thing I would expect from a company like Symantec
Jackson : Hi Martin, what I can do is, if you give me the order number and you agree, I will change the email address to an invalid email so you will not receive it.
Martin Barry: No, that is not acceptable.
Martin Barry: These emails misrepresent the situation and you should stop sending them
Jackson : Unfortunately I cannot stop the system from sending them. One of the solution is what I have suggested which is changing the listed email in the order.
Martin Barry: But it’s not “an order”
Jackson : I was referring to the SSL certificate order issued and you no longer require.
Martin Barry: Can you please file a bug against your “system”? Emails should explicitly state it’s expired, not “revoked”, and there should be no mention of “payment failure” if there was never any attempt to renew it. There should also be a way to explicitly indicate that the certificate is no longer required and all communication about it to be ceased.
Jackson : I see Martin, I will escalate this to my supervisor and liaise with Marketing.
Jackson : For the meantime, would you like to proceed with what I propose so you will stop receiving those email?
Martin Barry: No, I want to see how long you persist in sending them.
Jackson : May I have an order number so when I escalate this I could have an example to reference to?
Martin Barry: xxxxxxxx
Jackson : Thank you Martin, I will escalate this.

Posted in Internet, Tech | Tagged , , | Comments closed

Historical DNS Quirks

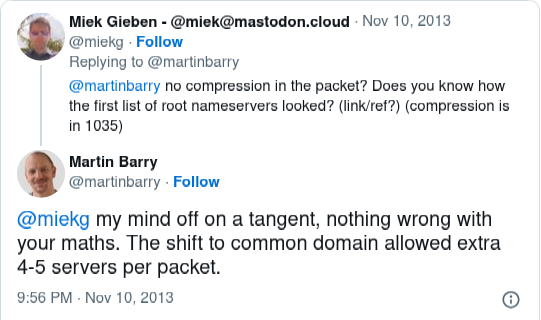
I love understanding the background of how particular parts of Internet infrastructure evolved to be how they currently are and the particular quirks of history that shaped them that way. Last night’s spelunking was triggered by this tweet from @miekg:

…which led him to write up his findings here.

His maths was correct, in that you could fit 14 root name servers in a 512 byte payload, and the presumption that only having 13 was mere conservatism seemed sensible .

But my mind quickly drifted onto the thought that the root name servers used to have unique names under their hosts domain (e.g. ns.nasa.gov) and hence not under root-servers.net which means that label compression saved roughly half as many bytes as is possible now with the shared domain. Those thoughts led to this confusing tweet:

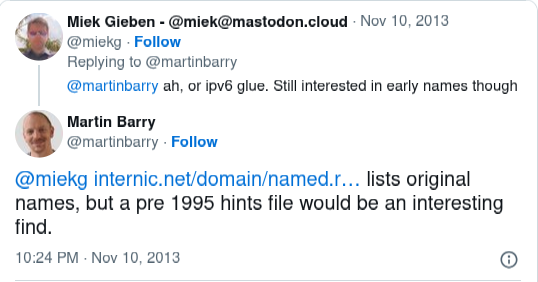
…followed up quickly with:

Along with www.internic.net/domain/named.root and www.donelan.com/dnstimeline.html, another interesting link I turned up was this DNS Root Name Server FAQ and @isomer dug up an old hints file from 1993.

An interesting quote from www.isoc.org/briefings/020/ is why VeriSign operates two roots:

Q: Why has IANA given two servers to VeriSign?

A: This answer needs a little bit of history: When the number of possible letters was increased to 13, IANA asked USC ISI and Network Solutions Inc. to set up additional servers with the intention to move them to suitable operators quickly thereafter. J&K were set up at Network Solutions on the US east coast, L&M at USC ISI on the west coast. Both K and M moved further east and west respectively soon thereafter. However as time progressed, moving a server became subject of increasingly inconclusive debates. Still IANA succeeded in moving L to ICANN. Some say this worked because ICANN was in the same building as both ISI and the IANA, a physical move was not immediately required and operations could be supported by the people operating B already. 😉 More likely it succeeded because ICANN at the time was the only organisation about which at least some consensus could be achieved. After that nothing moved anymore and J remained with VeriSign who had acquired Network Solutions.

Back to my original line of thought, the choice quotes from www.donelan.com/dnstimeline.html are:

21 Apr 1993
Root server list UDP packet size limit exceeded
31 Aug 1993
Bellovin suggests using pseudo-host root.net to pack server list

and

4 Aug 1995
root-servers.net introduced into root zone ns.nasa.gov changed ip addresses ns.isc.org uses net 39 experiment address
1 Sep 1995
ns.internic.net changed to a.root-servers.net (last root-servers.net change)

Basically the old scheme hit the limits at around 8 root servers and, in order to add more, a switch to a common domain was arranged to boost the effects of label compression. Of course, there was still room for improvement:

Posted in Internet, Tech | Tagged , | Comments closed

Monitoring network traffic: pmacct and Graphite

Recently at work we’ve needed to gain visibility on traffic flows across a global MPLS cloud. I would have explored open source solutions anyway but we didn’t have any budget so I was pushed that way regardless.

The first part of the puzzle came in the form of pmacct, a daemon that uses pcap to listen on an interface and capture traffic data for exporting to other stores (file, database) or forms (netflow, s-flow). We mirrored the relevant switch port and quickly had pmacctd capturing traffic flows and storing it temporarily in memory. Our configuration (/etc/pmacct/pmacctd.conf) is ridiculously simple:

daemonize: true
plugins: memory
aggregate: src_host, dst_host
interface: eth2
syslog: daemon
plugin_pipe_size: 10485760
plugin_buffer_size: 10240

The second part of the puzzle was trickier as we wanted to graph flows but could not be sure in advance of all the flows / data points involved. That ruled out a number of solutions that required pre-configuration of the data stores and graphs (e.g. Cacti). I settled on Graphite because of it’s ability to start collecting data for new flows when it received a data point it had never seen before. After the usual wrangling to get it working on Centos 6.3 the only real configuration required was in /opt/graphite/conf/storage-schemas.conf

[mpls]
pattern = ^mpls\.
retentions = 1s:30d

The final part of the puzzle was the glue to get the data out of pmacct and into Graphite. I wrote a simple Perl script that runs the pmacct client, reformats the data and then feeds it to the Graphite Carbon daemon. We originally had it running once per minute but eventually tried out 1 second intervals and, when that caused no issues, we stuck with that. I’d like to share the script but it has so many idiosyncrasies relevant only to our environment that there wouldn’t be much point. Perhaps if I find the spare time to generalise it a bit more I can add it later.

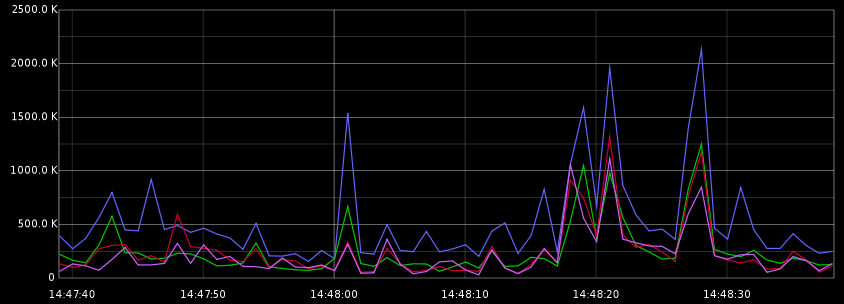
The end result is fantastic, being able to pull up graphs like this one which is using the Graphite functions to only show flows with maximum throughput greater than 1Mb/s. We already identified and resolved a production issue within the first 24 hours and another few in the first week.

Traffic graph generated by Graphite using data collected from pmacct.

Posted in Linux, Network, Tech, WebOps | Tagged , , , , | Comments closed

Fail2ban monitoring itself recursively

I use fail2ban to monitor brute force login attacks on my server. However it was quite clear that the short bans intended to deter bots but not real users with fat fingers weren’t actually deterring the bots. As soon as the ban was lifted a lot of bots come straight back and keep trying, only to get banned again. It was clear that what was needed was for fail2ban to monitor itself and ban IPs for longer after repeated shorter bans. Of course others had already figured this out so the configuration for my FAIL2BAN filter and jail came from here.

But after a few months of running that configuration it became clear that the bots would just wait out the longer ban and come straight back again. They are never going to get very far testing 15 user/pass combinations a week but those damn kids need to get off my lawn. Enter FAIL2SQUARED. This also monitors the fail2ban log file but it watches for just FAIL2BAN actions. If an IP gets a second ban in a month then FAIL2SQUARED will block it for 6 months.


filter.d/fail2squared.conf

failregex = fail2ban.actions:\s+WARNING\s+\[fail2ban\]\s+Ban\s+<HOST>


jail.conf

[fail2squared]

enabled = true
filter = fail2squared
action = iptables-allports[name=FAIL2SQUARED]
sendmail-whois-lines[name=FAIL2SQUARED, dest=root, sender=root, logpath=/var/log/fail2ban.log]
logpath = /var/log/fail2ban.log
maxretry = 2
# Find-time: 1 month
findtime = 2592000
# Ban-time: 6 months
bantime = 15552000

Posted in Internet, Linux, Tech | Tagged , | Comments closed

#newnewtwitter Mobile: UX clangers are just the beginning…

So I’ve been using Twitter’s mobile website for a while and it’s been updated a number of times, most recently a few months ago. There was no fanfare until just recently when #newnewtwitter was announced and it became clear that the current look was part of this redesign effort. What surprises me is that this site has 4 fundamental issues that irritate the hell out of me: default landing page; unauthenticated requests for restricted pages; language settings, and; picture links go to normal website.

Some background…

The UX issues (default landing page; unauthorised request for restricted page) have been particularly highlighted to me as I use an old work phone that I have lying around for want of something better. The sad part of this bit of the story is that the phone is running Windows Mobile 6.5. The tragic part of the story is that if you load any decent sized web page it deletes all cookies (I know, I know, #firstworldproblems). So while the UX issues might mildly annoy a normal user, losing the cookies and being repeatedly forced to re-authenticate makes the clangers really obvious and turns the rage up to 11.

Default landing page…

What is the more common task a user of a service is going to perform: registering an account or logging in? For everyone but a spammer the ratio will be 1 to “some really large number”. For a mobile site, where the user is more likely to have registered via other means already, the score will be more commonly 0 to “some really large number”. Common sense would indicate that your default landing page should be for the most common task, so present the user with a login form. Twitter have chosen to make the default landing page their registration form. Logging in requires following a link to the login form. Perhaps Twitter has some A/B testing that indicates this leads to more registrations but for existing users it just seems to be “pessimised” for the most common task.

Unauthenticated requests for restricted pages…

Most sites, when a user requests a restricted page before they have authenticated, have a fairly straight forward and smooth method of handling this.

  1. User requests a restricted page without being authenticated.
  2. Show the user a login form or redirect them to the login page.
  3. After successful authentication redirect the user back to the page they originally requested.

Twitter, in their wisdom, has chosen a different method for their mobile site.

  1. User requests a restricted page without being authenticated.
  2. Redirect the user to the registration page.
  3. User has to click through to the login page.
  4. After successful authentication redirect the user to the first page of their timeline.
  5. User has to manually navigate back to the page they originally requested.

Language settings…

Twitter’s mobile site ignores your language settings and uses geo-location of your IP address to select which language to display.

Picture links go to the normal website…

Don’t get me started on Twitter’s t.co self-serving service, and I know Twitter has no control over other links in tweets, but when someone has uploaded a picture to their pic.twitter.com service they haven’t bothered to offer a mobile friendly way of viewing those pictures, even if you a clicking through from their mobile site. I’m sure newer phones cope better with this but Opera on Windows Mobile 6.5 chokes horribly when presented with the main Twitter website.

Posted in Internet, Tech | Tagged , , , | Comments closed